Paris MoU Annual Report 2024
Subtitle
Summary
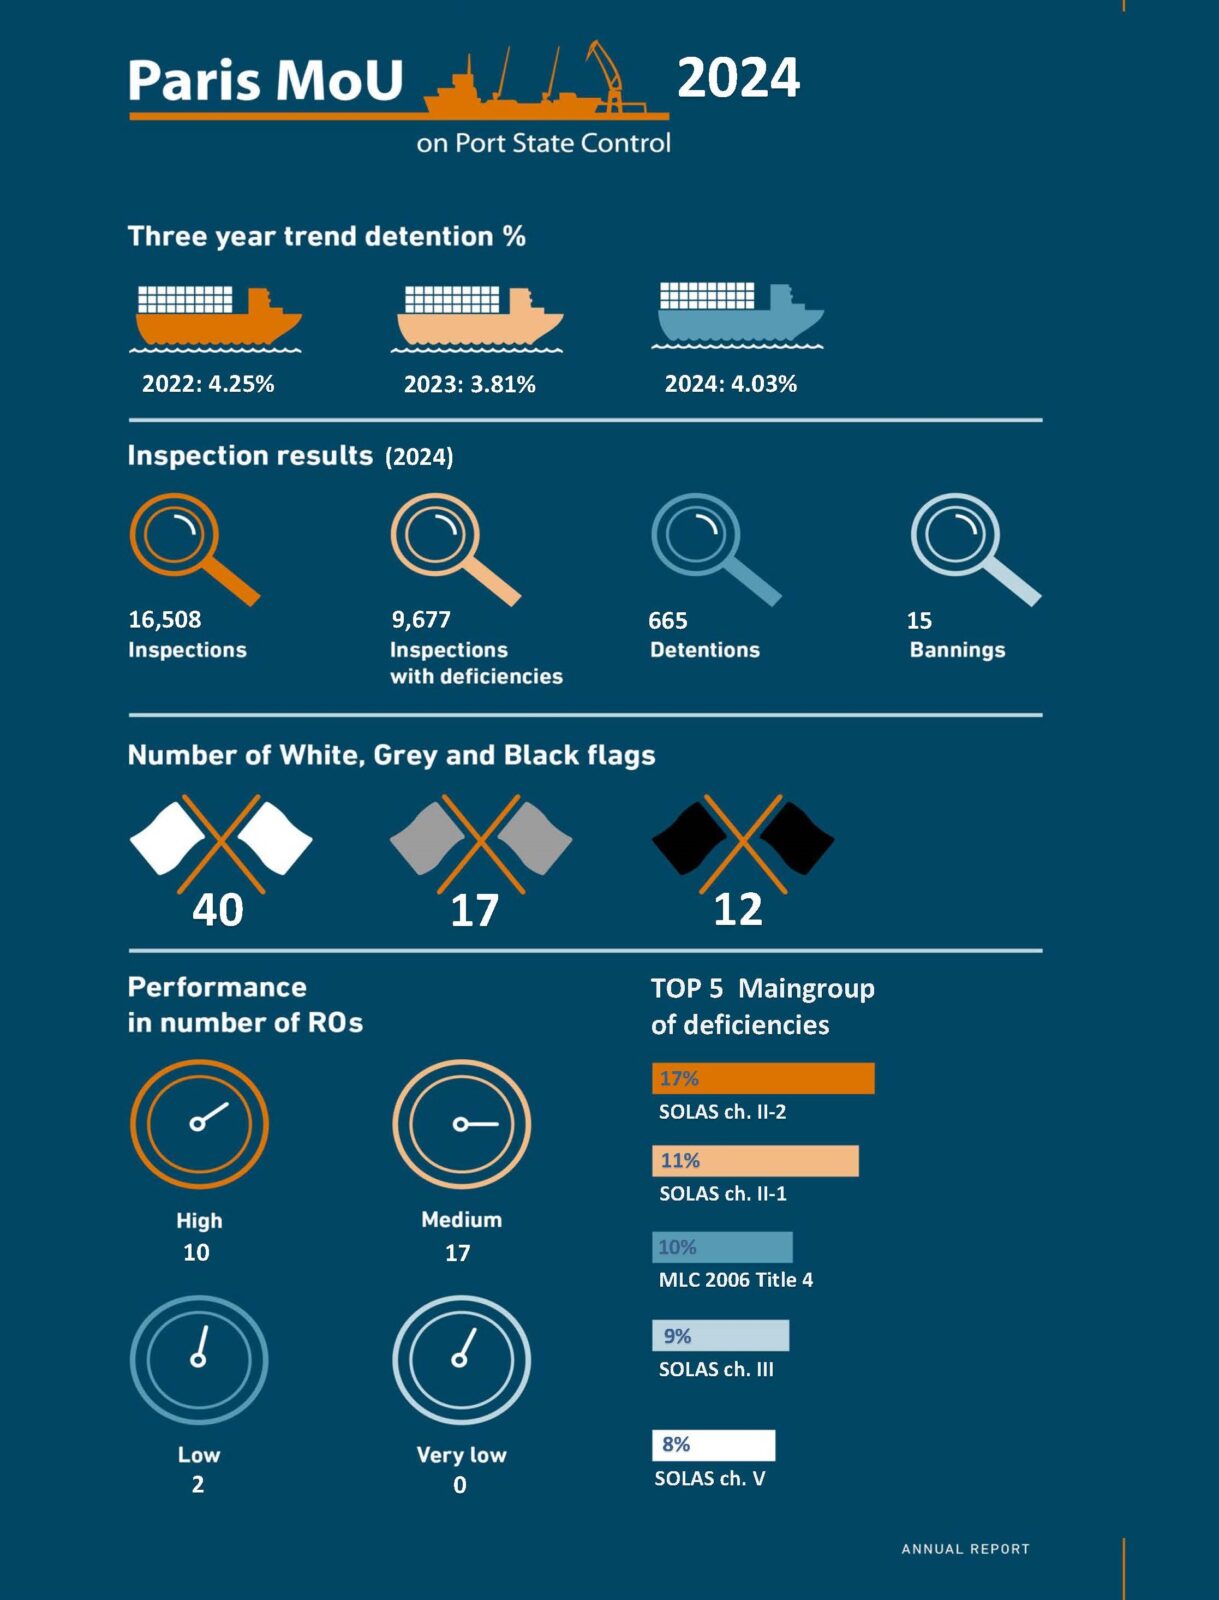
Throughout 2024, the refusals-of-access (bans) issued remained at a lower level than in the pre-COVID period. The number of bans was 15 and seems stable compared to previous years.
The detention rate for 2024 (4.03%) is increasing again compared to 2023 (3.81%). In addition to the increase, the detention percentage has remained consistently high for several years (4.25% in 2022). The Paris MoU will closely monitor this trend in the coming years.
Looking at the (detainable) deficiencies, there is not a particular convention or part of a convention that shows more non-compliance compared to previous years. There are the usual suspects of parts of conventions that show higher recording, both in numbers and relatively. These are respectively fire safety (SOLAS Chapter II-2: 17.2%), structural and electrical elements of the ship and electrical (SOLAS Chapter II-1: 11.3%) and health protection, medical care, welfare and social security protection (MLC title IV: 10,4%).
At deficiency level, ISM (4.6%), fire doors (3.2%) and Seafarers’ Employment Agreements (1.5%) show high rates of non-compliance.


Introduction
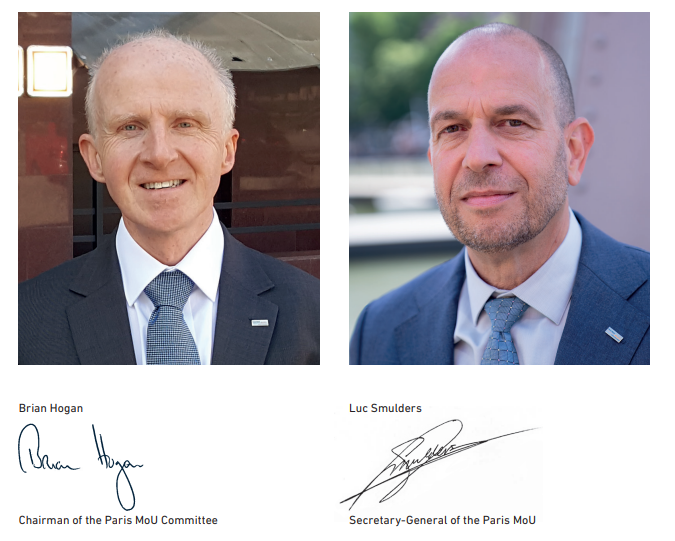
Chairman and Secretary-General
We are pleased to present the Paris MoU Annual Report for 2024, continuing our commitment to transparency and the enhancement of maritime safety. This year, we have further refined our digital approach, ensuring even greater accessibility for the public and the shipping industry. Our aim remains to provide clear and accessible information to all stakeholders.
For the past two years, we have expressed our concerns regarding the persistently high average detention rates. In 2022, we recorded a rate of 4.25%, with a slight improvement to 3.81% in 2023. However, in 2024, we observed a regrettable increase to 4.03%. These figures remain significantly higher than the pre-COVID-19 period, a trend that has persisted for the last three years. This necessitates continued close monitoring of developments in the coming period. Notably, an analysis of recorded deficiencies has not revealed any specific area as the primary cause of this increase in non-compliance. We urge all stakeholders to re-evaluate their operational practices and ensure adherence to international maritime standards.
A particularly alarming trend is the growing number of “false flag” ships worldwide. These ships are reported to be flying the flags of IMO member States and other States without the knowledge or authorisation of those States, and without possessing genuine certificates of registration. This evasion of legitimate flag State jurisdiction and control poses a significant threat to the safety of navigation, the well-being of seafarers, and the prevention of marine pollution. Such ships undermine the integrity of international maritime regulations, and we are working with the IMO and its member States to address this serious issue.
Compounding this concern is the increasing number of ships operating within the so-called “shadow” or “dark fleet”. By sailing through the coastal waters of Paris MoU member States without port calls, these ships effectively circumvent the Paris MoU’s risk-based port State control system. Because compliance with international maritime regulations cannot be monitored on these ships, risks to maritime safety and pollution prevention arise, impacting both the Paris MoU region and the global maritime community. Given the inherent limitations of Port State Control in effectively addressing the risks posed by ‘false flags’ and ‘shadow fleets’ which do not call to any ports, innovative strategies and intensified international cooperation are now indispensable.
Our collaborative efforts with other regional Port State Control regimes have been further strengthened through ongoing information sharing and coordinated inspection campaigns. The invaluable contributions of the International Maritime Organization and International Labour Organization have been crucial in promoting global harmonisation.
The Paris MoU remains steadfast in its commitment to fostering safer, cleaner, and more efficient shipping. We extend our sincere gratitude to the European Commission, EMSA, and all our partner organisations for their unwavering support. Above all, we acknowledge the dedication of our Port State Control Officers and maritime administration colleagues, whose tireless efforts are the foundation of our success.
We look forward to a future of enhanced maritime safety, seafarer welfare and environmental protection, while acknowledging the significant challenges that lie ahead.

Mission & Vision
The mission of the Paris MoU is to accomplish the elimination of substandard shipping by inspecting the ships in the region using a risk-based methodology. This risk-based inspection method ensures that the merchant ships in the region meet the international safety, security and environmental standards, and that crew members have adequate working and living conditions in compliance with the international maritime labour standards.
To actively pursue this mission, the Paris MoU focuses on the elements below:
- The Paris MoU will further develop its risk-based inspection mechanism to more effectively eliminate substandard shipping.
- This will keep pace with developments in technology and digitisation in the maritime industry.
- Increasing attention will be paid to effective control of environmental compliance by ships operating in the region.
- In addition, the Paris MoU will continue to focus on harmonisation within the Paris MoU itself as well strengthen harmonization with other Port State Control Agreements, including by facilitating the use of each other’s data.
- Given the importance that internationally operating fishing vessels are also subject to port State control, the Paris MoU will explore the possibility and feasibility of a port State control regime for fishing vessels.
Members and observers
The Paris MoU consists of the maritime Authorities of: Belgium, Bulgaria, Canada, Croatia, Cyprus, Denmark, Estonia, Finland, France, Germany, Greece, Iceland, Ireland, Italy, Latvia, Lithuania, Malta, Montenegro, Netherlands, Norway, Poland, Portugal, Romania, Russian Federation[1], Slovenia, Spain, Sweden, United Kingdom of Great Britain and Northern Ireland.
Various observer organisations participate in the meetings in the context of the Paris MoU. This concerns the International Maritime Organizations (IMO), the International Labour Organization (ILO) and the following other regional Port State Control Agreements: Abuja MoU, Acuerdo de Viña del Mar, Black Sea MoU, Caribbean MoU, Indian Ocean MoU, Mediterranean MoU, Riyadh MoU, Tokyo MoU and the United States Coast Guard.
[1] Suspended until further notice with effect from 20 May 2022
Main activities of Paris MoU regarding inspections and the harmonisation
Once a year, the Port State Control Committee, which is the executive body of the Paris MoU, meets in one of the member States. The Committee considers policy issues related to the regional implementation of port State control, reviews the work of the Technical Evaluation Group and task forces, and decides on administrative procedures.
The task forces are each assigned a specific work programme aimed at improving operational, technical and administrative port State control procedures. Reports from the task forces are discussed by the Technical Evaluation Group (TEG), in which all Paris MoU members and observers are represented. The evaluation by TEG is submitted to the Committee for final consideration and decision.
The MoU Advisory Board advises the Port State Control Committee on matters of a policy nature and provides direction to the task forces and the Secretariat between meetings of the Committee. The Board meets several times a year and in 2023 consisted of participants from Canada, Italy, France, the United Kingdom and the European Commission.
To achieve its mission, the Paris MoU carries out approximately 18,000 inspections annually. The results of these inspections are published at individual ship level and in various, more general information reports. In addition, of the option is given to download inspection results in bulk.
In order to strive for harmonisation between the member Authorities, the Paris MoU provides trainings and seminars for its Port State Control Officers (PSCOs).
Training plays an important role in achieving the goals of the Paris MoU (the elimination of substandard shipping) and aims to achieve a higher degree of harmonisation and standardisation of inspections across the region. During the year, the Secretariat, in cooperation with member Authorities, organises various trainings:
- Seminars;
- Expert Training (Safety & Environment and The Human Element);
- Specialised Training (Tanker, Bulk Carrier or Passenger Ships).
Participants from all member Authorities participated in one (or more) of the trainings and seminars. Representatives from other MoU Regions participated in various trainings and seminars; sometimes also as a trainer.
The seminar in June was hosted and organised by Canada and the seminar in by the United Kingdom. Some 180 Port State Control Officers took part in one of the training courses and seminars.
Role of EMSA
EMSA supports and advises the Paris MoU in various ways. For example, EMSA manages the information system in which the inspection results are recorded and ensures updates and upgrades to the system. The inspection data recorded in the system is not only relevant as input for the risk-based inspection methodology itself, but is also shared with the IMO in order to draw conclusions about compliance with IMO requirements. In addition, this information is also interesting and relevant for the Paris MoU member Authorities themselves, for the shipping industry and for the general public.
Secondly, EMSA participates in the work of the Paris MoU by attending meetings and participating in task forces to advise the members of possible developments in the European Union with regard to port State control.
In addition, in a joint effort with the Paris MoU, EMSA also offers training for new entrant PSCOs and for experienced PSCOs (refresher trainings). This training programme has been revised during the year and will be delivered in a new format as of 2025 with different modules on specific topics delivered online and face-to-face.
Developments
During the 2024 meeting of the Paris MoU Port State Control Committee (PSCC), several topics were discussed and decided.
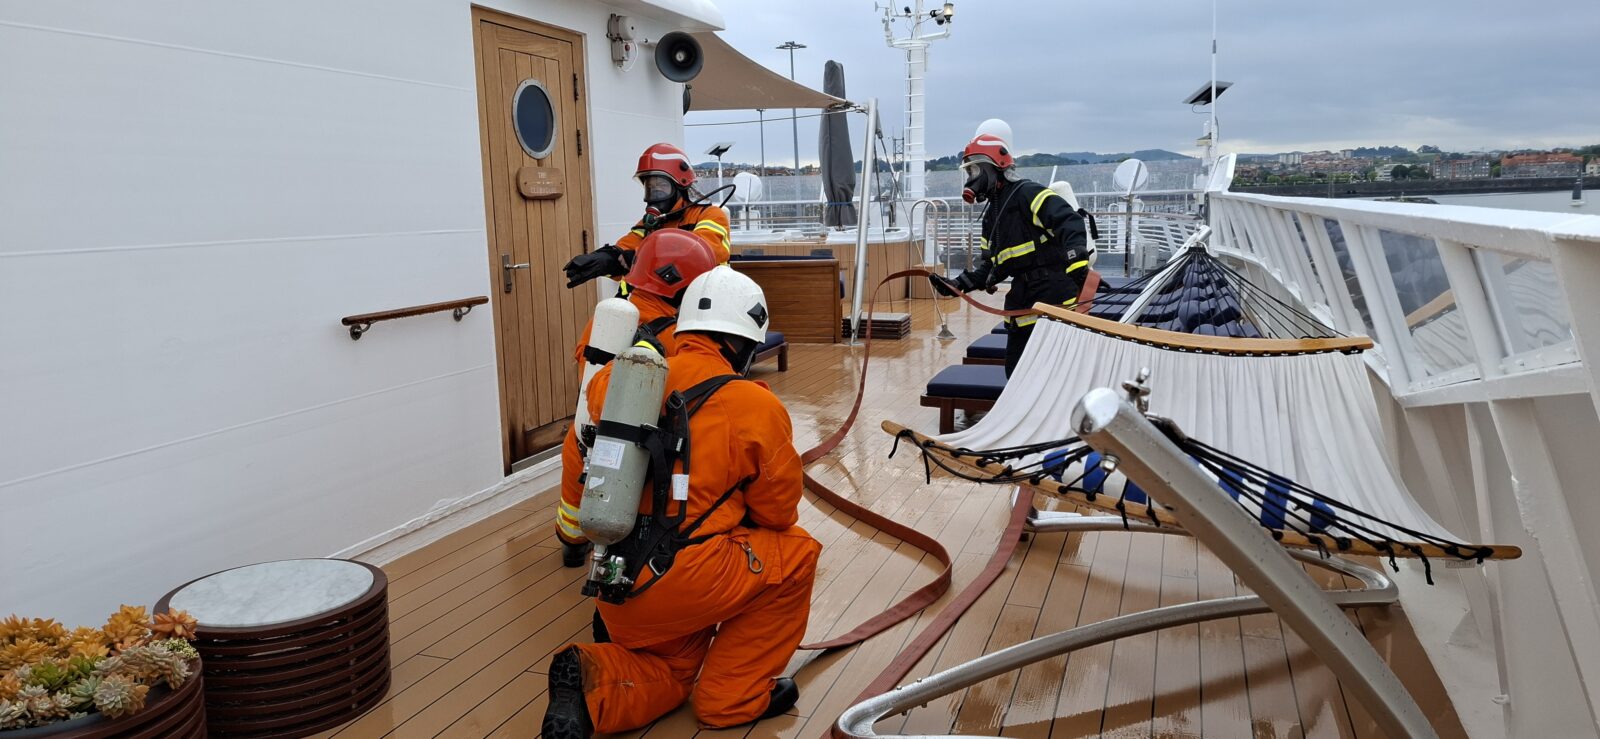
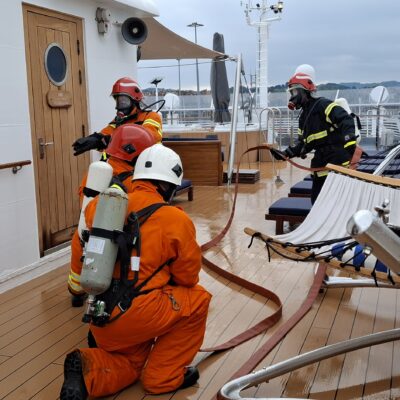
During its discussions, the Committee reviewed the evaluation of the Concentrated Inspection Campaign (CIC) on Fire Safety, held from 1 September to 30 November 2023. A total of 3,856 inspections were carried out using the CIC-questionnaire, revealing a high level of compliance overall. Detailed information on the CIC results has been made available on the Paris MoU website.
International Cooperation
The Paris MoU is actively involved in international meetings and initiatives to enhance the harmonisation in the field of port State control inspections.
Each year the Paris MoU participates in the IMO Sub-Committee meeting on Implementation of IMO Instruments (III Sub-Committee) where information is shared on the inspection results achieved in the previous year. Meeting documents are usually submitted jointly with other MoUs. A notable example of this is the joint submission by the Paris MoU, Tokyo MoU and the United States Coast Guard” on “underperforming Flag Administrations”.
The Paris MoU also maintains strong relationships with other regional port State control agreements, including by attending their Committee meetings when time and resources permit. In 2024, the Paris MoU physically participated in the meetings of the Caribbean MoU, Indian Ocean MoU and Tokyo MoU. Some other meetings were attended online, where possible.


Performance Lists
The Flag and RO Performance Lists have become a valuable tool for stakeholders in the maritime industry and beyond.
In terms of flag performance, there are no significant changes compared to previous year(s). The number of low-performing flags remains consistently low, below pre-COVID-19 levels. Despite a relatively high detention rate, the distribution of flag States across the White, Grey and Black lists remains largely unchanged.
Regarding RO performance, no deviating trends can be identified regarding the performance categories. A positive observation is that the number of ROs in the lowest performance category remains limited.
Compared to last year, the number of detainable deficiencies with RO responsibility remains at a higher level, resulting in more detainable deficiencies attributed to individual ROs. While this does not appear to have an impact on the performance categories, it does show a decline in the quality of some ROs.
Flag State Performance
White List
| Rank | Flag | Inspections | Detentions | Limit B<>G | Limit G<>W | Excess Factor |
|---|---|---|---|---|---|---|
| 1 | France | 297 | 1 | 29 | 13 | -1,78 |
| 2 | Denmark | 1246 | 14 | 103 | 72 | -1,75 |
| 3 | Norway | 1824 | 23 | 146 | 109 | -1,74 |
| 4 | Netherlands | 2690 | 46 | 211 | 166 | -1,61 |
| 5 | Singapore | 1745 | 28 | 140 | 104 | -1,61 |
| 6 | Cayman Islands (UK) | 318 | 3 | 30 | 14 | -1,52 |
| 7 | Finland | 364 | 4 | 34 | 17 | -1,50 |
| 8 | Italy | 846 | 14 | 72 | 47 | -1,48 |
| 9 | Luxembourg | 235 | 2 | 23 | 10 | -1,42 |
| 10 | Japan | 232 | 2 | 23 | 9 | -1,41 |
| 11 | Hong Kong (China) | 1596 | 34 | 129 | 94 | -1,40 |
| 12 | Sweden | 317 | 4 | 30 | 14 | -1,37 |
| 13 | Germany | 486 | 8 | 44 | 24 | -1,35 |
| 14 | China | 265 | 3 | 26 | 11 | -1,35 |
| 15 | Greece | 599 | 12 | 53 | 31 | -1,25 |
| 16 | Bahamas | 1758 | 45 | 141 | 105 | -1,25 |
| 17 | Portugal | 2050 | 54 | 163 | 124 | -1,24 |
| 18 | United Kingdom | 729 | 16 | 63 | 39 | -1,22 |
| 19 | Cyprus | 2226 | 63 | 176 | 136 | -1,17 |
| 20 | Malta | 3747 | 113 | 288 | 236 | -1,16 |
| 21 | Marshall Islands | 5470 | 181 | 414 | 351 | -1,09 |
| 22 | United States | 135 | 1 | 15 | 4 | -1,07 |
| 23 | Ireland | 91 | 0 | 11 | 2 | -1,05 |
| 24 | Bermuda (UK) | 154 | 2 | 16 | 5 | -0,90 |
| 25 | Isle of Man (UK) | 354 | 9 | 33 | 16 | -0,84 |
| 26 | Spain | 112 | 1 | 13 | 3 | -0,81 |
| 27 | Barbados | 863 | 29 | 73 | 48 | -0,81 |
| 28 | Liberia | 6035 | 257 | 456 | 389 | -0,76 |
| 29 | Gibraltar (UK) | 293 | 8 | 28 | 13 | -0,68 |
| 30 | Faroe Islands | 225 | 6 | 23 | 9 | -0,56 |
| 31 | Belgium | 168 | 4 | 18 | 6 | -0,48 |
| 32 | Türkiye | 607 | 25 | 53 | 32 | -0,42 |
| 33 | Estonia | 84 | 1 | 10 | 2 | -0,33 |
| 34 | Lithuania | 100 | 2 | 12 | 2 | -0,15 |
| 35 | Antigua and Barbuda | 1708 | 95 | 137 | 102 | -0,14 |
| 36 | Thailand | 51 | 0 | 7 | 0 | -0,09 |
| 37 | Poland | 46 | 0 | 7 | 0 | 0,02 |
| 38 | Jersey (UK) | 44 | 0 | 6 | 0 | 0,03 |
| 39 | Canada | 36 | 0 | 6 | 0 | 0,08 |
| 40 | Egypt | 36 | 0 | 6 | 0 | 0,08 |
Grey List
| Rank | Flag | Inspections | Detentions | Limit B<>G | Limit G<>W | Excess Factor |
|---|---|---|---|---|---|---|
| 41 | Saudi Arabia | 72 | 1 | 9 | 1 | 0,00 |
| 42 | Croatia | 92 | 2 | 11 | 2 | 0,01 |
| 43 | India | 55 | 1 | 7 | 0 | 0,11 |
| 44 | Latvia | 162 | 7 | 17 | 5 | 0,13 |
| 45 | Korea, Republic of | 178 | 8 | 19 | 6 | 0,13 |
| 46 | Morocco | 48 | 1 | 7 | 0 | 0,15 |
| 47 | Russian Federation | 265 | 14 | 26 | 11 | 0,19 |
| 48 | Panama | 5854 | 390 | 442 | 377 | 0,20 |
| 49 | Lebanon | 38 | 2 | 6 | 0 | 0,39 |
| 50 | Cook Islands | 81 | 5 | 10 | 1 | 0,42 |
| 51 | Philippines | 105 | 7 | 12 | 3 | 0,46 |
| 52 | Albania | 58 | 4 | 8 | 0 | 0,49 |
| 53 | Algeria | 77 | 6 | 10 | 1 | 0,57 |
| 54 | Saint Vincent and the Grenadines | 246 | 19 | 24 | 10 | 0,63 |
| 55 | Sierra Leone | 173 | 14 | 18 | 6 | 0,66 |
| 56 | Tunisia | 30 | 3 | 5 | 0 | 0,66 |
| 57 | Bangladesh | 43 | 5 | 6 | 0 | 0,81 |
Black List
| Rank | Flag | Inspections | Detentions | Limit B<>G | Limit G<>W | Excess Factor | Risk |
|---|---|---|---|---|---|---|---|
| 60 | Belize | 199 | 21 | 20 | 8 | 1,09 | Medium Risk |
| 61 | Palau | 334 | 33 | 32 | 15 | 1,13 | Medium Risk |
| 62 | Ukraine | 54 | 9 | 7 | 0 | 1,76 | Medium Risk |
| 63 | Algeria | 76 | 12 | 9 | 1 | 1,86 | Medium Risk |
| 64 | Togo | 310 | 41 | 30 | 14 | 2,08 | Medium to High |
| 65 | Azerbaijan | 34 | 7 | 5 | 0 | 2,16 | Medium to High |
| 66 | Vanuatu | 353 | 50 | 33 | 16 | 2,42 | Medium to High |
| 67 | Comoros | 281 | 41 | 27 | 12 | 2,44 | High Risk |
| 68 | Viet Nam | 37 | 9 | 6 | 0 | 3,23 | Very High Risk |
| 69 | Moldova, Republic of | 116 | 23 | 13 | 3 | 3,36 | Very High Risk |
| 70 | Tanzania, United Republic of | 119 | 29 | 13 | 3 | 4,71 | Very High Risk |
| 71 | Cameroon | 122 | 35 | 14 | 3 | 6,03 | Very High Risk |
RO Performance
In this table only Recognized Organizations that had 60 or more inspections in a 3-year period are taken into account. The formula is identical to the one used for the White, Grey and Black list. However, the values for P and Q are adjusted to P=0.02 and Q=0.01. Performance of recognized organizations is measured over a 3-year rolling period.
RO Performance
| Recognized Organization | RO abbrev. | Inspections | Detentions | Low/ medium limit | Medium/high limit | Excess Factor | Performance level |
|---|---|---|---|---|---|---|---|
| American Bureau of Shipping | ABS | 6.438 | 2 | 148 | 110 | -1,95 | High |
| DNV AS | DNV | 23.476 | 36 | 505 | 434 | -1,83 | High |
| Lloyd's Register | LR | 12.071 | 30 | 267 | 216 | -1,70 | High |
| Korean Register | KR | 2.106 | 4 | 53 | 31 | -1,67 | High |
| Bureau Veritas | BV | 12.179 | 36 | 269 | 218 | -1,65 | High |
| China Classification Society | CCS | 1.238 | 2 | 33 | 16 | -1,62 | High |
| RINA Services S.p.A. | RINA | 6.426 | 19 | 147 | 110 | -1,62 | High |
| Nippon Kaiji Kyokai | NKK | 8.922 | 51 | 201 | 156 | -1,30 | High |
| Russian Maritime Register of Shipping | RMRS | 476 | 1 | 15 | 4 | -0,91 | High |
| Polski Rejestr Statkow (Polish Register of Shipping) | PRS | 536 | 4 | 17 | 5 | -0,23 | High |
| Croatian Register of Shipping | CRS | 183 | 1 | 7 | 0 | 0,13 | Medium |
| Dromon Bureau of Shipping | DBS | 626 | 8 | 19 | 6 | 0,14 | Medium |
| Phoenix Register of Shipping | PHRS | 660 | 9 | 20 | 7 | 0,17 | Medium |
| Turkish Lloyd | TL | 288 | 3 | 10 | 1 | 0,19 | Medium |
| Qualitas Register of Shipping S.A. | QRS | 134 | 1 | 6 | 0 | 0,23 | Medium |
| Intermaritime Certification Services, ICS Class | ICS | 79 | 1 | 4 | 0 | 0,39 | Medium |
| Indian Register of Shipping | IRS | 289 | 5 | 10 | 1 | 0,41 | Medium |
| Veritas Register of Shipping Ltd | VRS | 98 | 2 | 5 | 0 | 0,51 | Medium |
| Bulgarian Register of Shipping | BRS | 314 | 7 | 11 | 2 | 0,58 | Medium |
| National Shipping Adjuster Inc. | NASHA | 75 | 2 | 4 | 0 | 0,60 | Medium |
| Macosnar Corporation | MC | 71 | 2 | 4 | 0 | 0,62 | Medium |
| Panama Maritime Documentation Services | PMDS | 158 | 4 | 7 | 0 | 0,62 | Medium |
| Shipping Register of Ukraine | SRU | 111 | 3 | 5 | 0 | 0,63 | Medium |
| Overseas Marine Certification Services | OMCS | 239 | 6 | 9 | 1 | 0,65 | Medium |
| Isthmus Bureau of Shipping, S.A. | IBS | 220 | 6 | 8 | 0 | 0,70 | Medium |
| International Naval Surveys Bureau | INSB | 561 | 14 | 17 | 5 | 0,73 | Medium |
| United Registration and Classification of Services | URACOS | 318 | 10 | 11 | 2 | 0,90 | Medium |
| International Register of Shipping | IS | 353 | 12 | 12 | 2 | 1,03 | Low |
| Hellas Naval Bureau of Shipping S.M.P.C | HNBS | 107 | 6 | 5 | 0 | 1,61 | Low |
Statistics
The information published by the Paris MoU in its Annual Report mainly contains general information on inspection results and is aimed at the public in general and the shipping industry in particular. Flag States and Recognized Organizations (ROs) are mainly addressed in the latter category.
Number of Inspections
Number of individual ships inspected
Number of Deficiencies
Number of Detainable Deficiencies
Number of Detentions
Detention in % of Inspections
Detention per Flag, Exceeding Average Percentage


Major Categories of Deficiencies
| 2021 | 2022 | 2023 | |||||
|---|---|---|---|---|---|---|---|
| Deficiency Main Group | Def | Def % | Def | Def % | Def | Def % | |
| Ballast Water Management | 898 | 1,9 | 907 | 1,9 | 964 | 1,9 | |
| COLREG | 444 | 0,9 | 441 | 0,9 | 453 | 0,9 | |
| Load Lines | 2.758 | 5,8 | 2.644 | 5,6 | 2.620 | 5,2 | |
| MARPOL | MARPOL Annex I | 1.530 | 3,2 | 1.528 | 3,2 | 1.635 | 3,3 |
| MARPOL Annex IV | 418 | 0,9 | 515 | 1,1 | 486 | 1,0 | |
| MARPOL Annex V | 821 | 1,7 | 930 | 2,0 | 977 | 2,0 | |
| MARPOL Annex VI | 618 | 1,3 | 771 | 1,6 | 851 | 1,7 | |
| MARPOL Other | 47 | 0,1 | 57 | 0,1 | 75 | 0,2 | |
| MLC | MLC 2006 Title 2 | 1.453 | 3,1 | 1.181 | 2,5 | 1.442 | 2,9 |
| MLC 2006 Title 3 | 3.201 | 6,7 | 3.151 | 6,6 | 3.538 | 7,1 | |
| MLC 2006 Title 4 | 4.875 | 10,2 | 4.750 | 10,0 | 5.189 | 10,4 | |
| MLC 2006 Title 5 | 319 | 0,7 | 289 | 0,6 | 370 | 0,7 | |
| MLC Other | 168 | 0,4 | 198 | 0,4 | 116 | 0,2 | |
| SOLAS | SOLAS ch.I | 506 | 1,1 | 501 | 1,1 | 530 | 1,1 |
| SOLAS ch.II-1 | 5.520 | 11,6 | 5.444 | 11,5 | 5.653 | 11,3 | |
| SOLAS ch.II-2 | 7.360 | 15,5 | 8.227 | 17,3 | 8.617 | 17,2 | |
| SOLAS ch.III | 4.541 | 9,5 | 4.391 | 9,2 | 4.506 | 9,0 | |
| SOLAS ch.IV | 844 | 1,8 | 793 | 1,7 | 781 | 1,6 | |
| SOLAS ch.V | 3.961 | 8,3 | 3.843 | 8,1 | 3.813 | 7,6 | |
| SOLAS ch.VI | 285 | 0,6 | 224 | 0,5 | 255 | 0,5 | |
| SOLAS ch.XI-1 | 492 | 1,0 | 404 | 0,9 | 442 | 0,9 | |
| SOLAS ISM Code | 2.284 | 4,8 | 2.308 | 4,9 | 2.309 | 4,6 | |
| SOLAS ISPS Code | 432 | 0,9 | 420 | 0,9 | 353 | 0,7 | |
| SOLAS LSA Code | 320 | 0,7 | 331 | 0,7 | 422 | 0,8 | |
| SOLAS Other | 954 | 2,0 | 869 | 1,8 | 748 | 1,5 | |
| STCW | STCW Code Part A ch.I | 753 | 1,6 | 615 | 1,3 | 501 | 1,0 |
| STCW Code Part A ch.VIII | 1.037 | 2,2 | 1.112 | 2,3 | 841 | 1,7 | |
| STCW Other | 242 | 0,5 | 245 | 0,5 | 675 | 1,4 | |
| OTHER | 488 | 1,0 | 421 | 0,9 | 796 | 1,6 |
Inspections and Detentions per Ship Type
| Ship Type | Nr of Inspections | Inspections with deficiencies | Percentage of inspections with deficiencies | Nr of Individual ships inspected | Inspections with detentions | Percentage of detentions to inspections 2024 | Percentage of detentions to inspections 2023 | Percentage of detentions to inspections 2022 | +/ - average detention % 2024 |
|---|---|---|---|---|---|---|---|---|---|
| Bulk carrier | 3.839 | 2.494 | 64,96 | 3.508 | 181 | 4,7 | 3,6 | 5,1 | 0,7 |
| Chemical tanker | 451 | 249 | 55,21 | 410 | 20 | 4,4 | 2,1 | 2,9 | 0,4 |
| Combination carrier | 7 | 3 | 42,86 | 6 | - | 0,0 | 0,0 | 0,0 | -4,0 |
| Commercial yacht | 213 | 83 | 38,97 | 210 | 6 | 2,8 | 5,5 | 3,2 | -1,2 |
| Container | 1.921 | 1.005 | 52,32 | 1.772 | 20 | 1,0 | 2,1 | 2,5 | -3,0 |
| Dredger | 90 | 46 | 51,11 | 86 | 1 | 1,1 | 1,1 | 2,4 | -2,9 |
| Fish factory | 6 | 6 | 100,00 | 5 | - | 0,0 | 0,0 | 0,0 | -4,0 |
| Gas carrier | 458 | 184 | 40,17 | 425 | 5 | 1,1 | 1,6 | 1,0 | -2,9 |
| Gas Carrier/NLS tanker | 10 | 6 | 60,00 | 10 | - | 0,0 | 0,0 | 0,0 | -4,0 |
| General cargo/multipurpose | 4.175 | 2.840 | 68,02 | 3.364 | 292 | 7,0 | 7,0 | 7,0 | 3,0 |
| Heavy load | 59 | 21 | 35,59 | 56 | 1 | 1,7 | 3,6 | 2,7 | -2,3 |
| High speed cargo | 24 | 9 | 37,50 | 24 | - | 0,0 | 0,0 | 0,0 | -4 |
| High speed passenger craft | 84 | 48 | 57,14 | 56 | 2 | 2,4 | 0,0 | 2,6 | -1,6 |
| Livestock carrier | 86 | 76 | 88,37 | 62 | 13 | 15,1 | 8,0 | 7,9 | 11,1 |
| MODU & FPSO | 24 | 13 | 54,17 | 24 | 1 | 4,2 | 0,0 | 0,0 | 0,2 |
| NLS tanker | 9 | 5 | 55,56 | 7 | 1 | 11,1 | 0,0 | 0,0 | 7,1 |
| Offshore supply | 381 | 218 | 57,22 | 369 | 6 | 1,6 | 3,1 | 3,1 | -2,4 |
| Oil tanker | 1.009 | 454 | 45,00 | 953 | 24 | 2,4 | 3,0 | 2,5 | -1,6 |
| Oil tanker/Chemical tanker | 1.347 | 679 | 50,41 | 1.213 | 44 | 3,3 | 2,2 | 2,7 | -0,7 |
| Oil tanker/Gas carrier | 1 | - | - | 1 | - | 0,0 | 0,0 | 0,0 | -4,0 |
| Oil tanker/NLS tanker | 1 | 1 | 100,00 | 1 | - | 0,0 | 0,0 | 0,0 | -4,0 |
| Other special activities | 408 | 219 | 53,68 | 399 | 7 | 1,7 | 3,0 | 4,1 | -2,3 |
| Passenger ship | 282 | 129 | 45,74 | 261 | 3 | 1,1 | 1,1 | 2,9 | -2,9 |
| Refrigerated cargo | 124 | 79 | 63,71 | 119 | 7 | 5,6 | 3,0 | 2,0 | 1,6 |
| Ro-Ro cargo | 646 | 290 | 44,89 | 605 | 12 | 1,9 | 2,2 | 1,8 | -2,1 |
| Ro-Ro passenger ship | 494 | 322 | 65,18 | 272 | 9 | 1,8 | 2,3 | 2,3 | -2,2 |
| Special purpose ship | 113 | 53 | 46,90 | 112 | 2 | 1,8 | 1,5 | 0,7 | -2,2 |
| Tug | 246 | 145 | 58,94 | 239 | 8 | 3,3 | 4,9 | 7,3 | -0,7 |